Skip to content
image0
CDEBC24B-3DD9-429A-BA6F-246A7C3F75E4-crop
microglia-capabiltiies-banner
CASE STUDY

Microglia Biology

Review a range of microglia assays that evaluate the effects of therapeutic agents on cell morphology, inflammasome formation, phagocytosis, chemotaxis, and neurite networks.

OVERVIEW

PhenoVista has experience working on a range of assays measuring the effects of therapeutic candidates on microglia morphology and behavior.

HIGHLIGHTS

  • Example assays
  • Representative images
  • Quantitative results

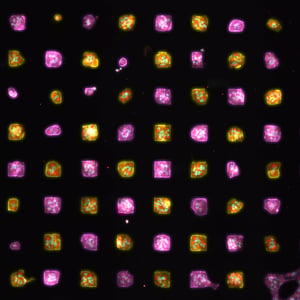
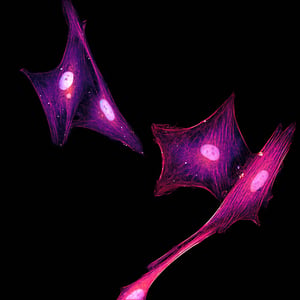
REPRESENTATIVE IMAGES

Representative images of iPSC-derived microglia, modeling adrenoleukodystrophy

microglia-capabilities-rep-images

DOWNLOAD THE COMPLETE CASE STUDY

Browse representative images and data measuring various aspects of microglia biology.

microglia-capabilities-thumbnail

RELATED RESOURCES

R2G-microglia-phagocytosis-1200x627-v2

BROCHURE

Ready-2-Go Microglia Phagocytosis Handout

Learn about how PhenoVista's R2g Microglia Phagocytosis Assay Service can help you measure uptake of bacterial bioparticles by human, iPSC-derived microglia.

parkinsons-capabilities-thumbnail-1200x627

APP NOTE

Phenotypic Studies to De-risk Parkinson's Disease R&D

Learn about Parkinson's disease (PD) and review examples of phenotypic studies designed to measure aspects of PD-relevant biology.

CNS-tri-culture-thumbnail-1200x627

CASE STUDY

Evaluating a Therapeutic Agent's Effects on Various Health Metrics in a Neuronal Tri-culture

Review an example study using a custom, neuronal tri-culture model to evaluate a therapeutic agent's effects on various health metrics.

CONTACT US

Let's discuss how we can help with your next study.

DOWNLOAD THE CASE STUDY

Induction & Inhibition of Fibrotic State Using a Novel, Biologic Therapeutic

Overview

Review an example of a study designed to measure fibrosis induction and inhibition in hepatic stellate cells (HSCs).

Highlights

  • Overview of study objective and goals
  • Experimental design, including timelines and deliverables
  • Representative images and graphs
  • Study results

fibrosis-in-HSCs-thumbnail